Mercedes-Benz achieves fifth sales record year in a row
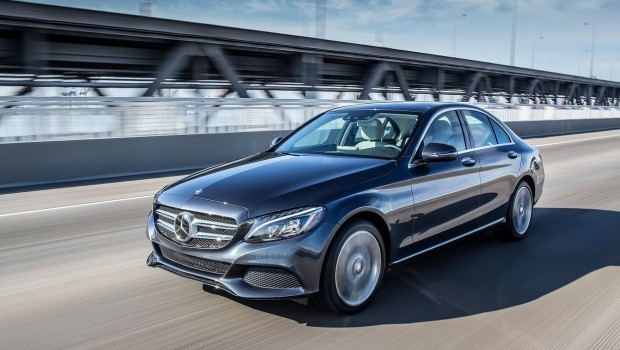
Mercedes-Benz delivered more cars to customers in 2015 than ever before in one year. The Stuttgart-based premium brand with the three-pointed star sold a total of 1,871,511 vehicles (+13.4%), posting its fifth record year in a row. Furthermore, the year 2015 ended for Mercedes-Benz with its strongest-selling December (178,017 units, +9.1%) and best quarter (495.159 units, +8.8%). Growth drivers in 2015 were the SUVs and the compact cars. For the first time, more than half a million units were sold in each segment.
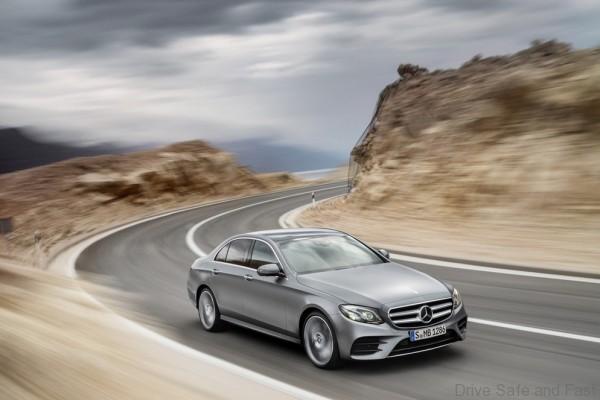
In Europe, Mercedes-Benz sold more cars in 2015 than ever before in one year: A total of 798,852 customers decided in favour of a car with the three-pointed star (+10.5%). In the highly competitive German market, Mercedes-Benz once again maintained its market leadership amongst the premium manufacturers in 2015. Unit sales in Germany increased by 4.7% in 2015. In Great Britain, the second-largest European market, another sales record was set in 2015 with a total of 144,474 vehicles handed over to customers (+17.0%). The brand achieved double-digit growth in unit sales in nearly all of the region’s markets, with particularly high rates in Italy (+13.8%), Spain (+27.3%), Turkey (+30.9%), Switzerland (+21.6%) and Netherlands (+30.7%). In Portugal, Mercedes-Benz was the premium brand with the most new registrations in 2015.
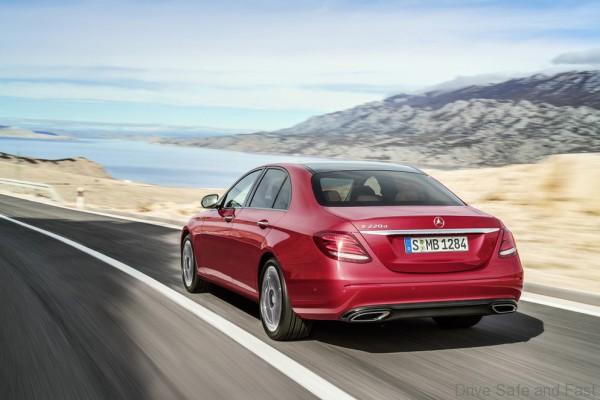
In the Asia-Pacific region, demand for Mercedes-Benz models has never been as strong as in December and in the full year. Sales there grew last year by a quarter to 615,325 units. The biggest growth market was China, where Mercedes-Benz launched more than 15 new or updated models and expanded the dealer network to approximately 500 dealerships last year. Local production capacities were also expanded. In addition to the C- and E-Class, the two SUV models GLA and GLC started to be produced in China last year. For the first time, China is the biggest sales market for Mercedes-Benz. With 373,459 vehicles sold, an increase of 32.6%, unit sales in 2015 were significantly higher than ever before. Growth in the Asia-Pacific region was boosted in 2015 also by sales in South Korea (+26.8%), India (+32.4%) and Malaysia (+56.5%), where new records were set. In Japan, the region’s second-largest market, more cars were sold than ever before (64,989 units, +7.1%). In 2015, Mercedes-Benz was the premium brand with the most new registrations in Japan, Australia and Taiwan.
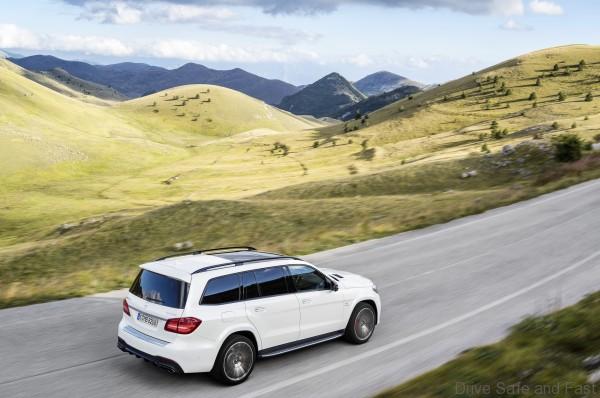
In the NAFTA region, new sales records were set in December and in the full year as a result of the best-ever unit sales in the USA, Canada and Mexico. 38,557 cars were handed over to customers in the last month of the year (+2.1%), and sales in the full year increased to 392,843 units (+5.2%). From January to December, sales in the USA grew to 343,088 units (+3.8%). And in Canada, Mercedes-Benz was the market leader amongst the premium manufacturers in 2015.
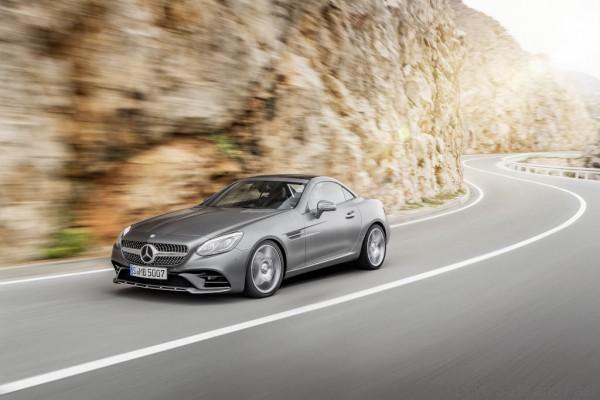
Mercedes-AMG can look back on a record year 2015: With 68,875 units sold (+44.6%), the sports-car and high-performance brand of Mercedes-Benz reached a new peak last year. This means that its unit sales have more than doubled in the past two years. In addition to the new AMG sports models launched in 2015, the growth drivers include the high-performance models of the C-Class and the compact cars. The new and independently developed Mercedes-AMG GT was also very popular with customers. The strongest sales markets for AMG automobiles were the USA, Germany and China.
Overview of sales by Mercedes-Benz Cars
December 2015 | Change in % | Full-year 2015 | Change. in % | |
Mercedes-Benz | 178,017 | +9.1 | 1,871,511 | +13.4 |
smart | 10,023 | -3.1 | 119,398 | +32.9 |
Mercedes-Benz Cars | 188,040 | +8.3 | 1,990,909 | +14.4 |
Mercedes-Benz unit sales in the region/market | ||||
Europe | 72,246 | +8.2 | 798,852 | +10.5 |
– thereof Germany | 24,127 | +6.3 | 273,435 | +4.7 |
Asia-Pacific | 61,868 | +21.8 | 615,325 | +25.2 |
– thereof Japan | 6,627 | -9.6 | 64,989 | +7.1 |
– thereof China | 37,771 | +31.3 | 373,459 | +32.6 |
NAFTA | 38,557 | +2.1 | 392,843 | +5.2 |
– thereof USA | 34,203 | +0.6 | 343,088 | +3.8 |


