The Volkswagen Group reported considerable growth in sales revenue and earnings in the first six months of the year in a very challenging environment. Sales revenue rose by 10.1 percent to EUR 108.8 billion (EUR 98.8 billion) in the first half of the year, primarily due to exchange rate effects and an improved product mix. Operating profit before special items grew by 13.0 percent to EUR 7.0 billion (EUR 6.2 billion). Restructuring measures in the trucks business led to an operating profit after special items of EUR 6.8 billion (EUR 6.2 billion). The operating return on sales remained stable at 6.3 percent (6.3 percent). The Group’s operating profit and sales revenue exclude the activities of the Chinese joint ventures, which are accounted for in the financial result using the equity method. At EUR 2.7 billion (EUR 2.6 billion), the share of operating profit attributable to the Chinese joint ventures was level year-on-year in the first half of 2015.
The Volkswagen Group’s profit before tax remained almost level at EUR 7.7 billion (EUR 7.8 billion) despite the negative effects from fair value measurement in the financial result. Profit after tax remained unchanged as against the prior-year period, at EUR 5.7 billion (EUR 5.7 billion).
Brands and Business Fields
Global new passenger car registrations increased between January and June 2015. However, trends in the individual regions were mixed. While growth was driven by the Asia-Pacific, North America and Western Europe regions, new passenger car registrations in South America and Eastern Europe saw declines, some of which were severe.
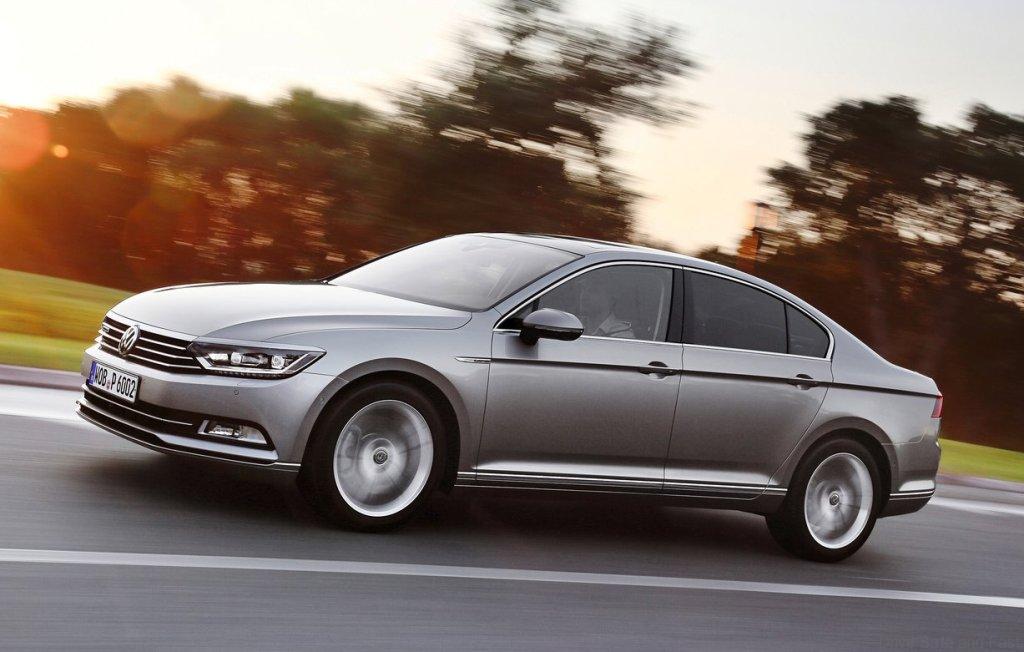
Operating profit at Volkswagen Passenger Cars rose to EUR 1.4 billion (EUR 1.0 billion) due to sales revenue and cost optimization, as well as positive exchange rate effects. Although the markets in South America and Russia were negative factors, there were positive effects from the efficiency program. The operating margin amounted to 2.7 percent (2.1 percent).
Audi’s operating profit rose to EUR 2.9 billion (EUR 2.7 billion) due to sales growth and positive exchange rate effects; its operating margin amounted to 9.8 percent (10.0 percent). High upfront investments in new products and technologies, as well as the expansion of the international production network, weighed on earnings.
Operating profit at ŠKODA increased to EUR 522 million (EUR 425 million), mainly due to mix effects, more favorable exchange rates and lower material costs. The operating margin was 8.1 percent (7.1 percent).
The SEAT brand continued its growth trend, lifting its operating profit to EUR 52 million (previous year: operating loss of EUR 37 million). This was primarily due to higher volumes, positive exchange rate effects and cost optimization.
Bentley generated an operating profit of EUR 54 million (EUR 95 million) due to lower vehicle sales and higher upfront expenditures.
Porsche’s operating profit improved to EUR 1.7 billion (EUR 1.4 billion) and the brand’s operating margin was 15.7 percent (17.1 percent). Positive volume and exchange rate effects more than offset the negative impact of changes in the mix, increased structural costs and higher development costs.
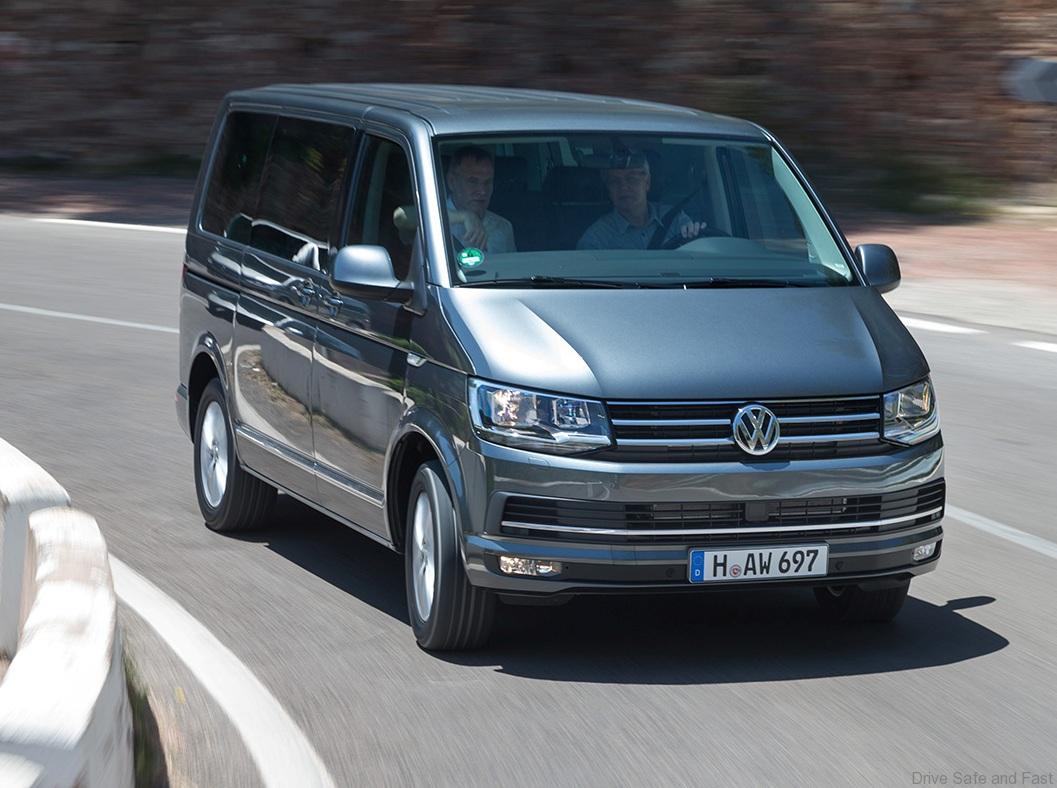
Volkswagen Commercial Vehicles is renewing its product range and posted an operating profit of EUR 268 million (EUR 280 million). The operating margin amounted to 5.1 percent (5.9 percent).
Scania generated an operating profit of EUR 503 million (EUR 476 million) and an operating return on sales of 9.7 percent (9.4 percent). MAN recorded an operating profit before restructuring expenses of EUR 185 million (EUR 222 million) and an operating return on sales of 2.8 percent (3.3 percent). Restructuring measures resulted in special items of EUR
– 170 million.
Operating profit at Volkswagen Financial Services amounted to EUR 970 million (EUR 776 million). Its operating return on sales was 7.5 percent (7.4 percent). The number of new contracts signed worldwide rose by 6.4 percent year-on-year to 2.5 million.
The Volkswagen Group expects that deliveries to customers will remain on a level with the previous year in 2015 in a persistently challenging market environment. Depending on economic conditions, 2015 sales revenue for the Volkswagen Group and its business areas is expected to increase by up to four percent above the prior-year figure. However, economic trends in Latin America and Eastern Europe will need to be continuously monitored in the Commercial Vehicles/Power Engineering Business Area.
In terms of the Group’s operating profit, Volkswagen continues to anticipate an operating return on sales of between 5.5 percent and 6.5 percent in 2015. Volkswagen expects the operating return on sales to be in the 6.0 percent to 7.0 percent range in the Passenger Cars Business Area, and between 2.0 percent and 4.0 percent in the Commercial Vehicles/Power Engineering Business Area. For the Financial Services Division, Volkswagen is forecasting an operating profit at the prior-year level.
2015 | 2014 | % | 2015 | 2014 | % | |
Q2 | Q2 | H1 | H1 | |||
| Volume data | ||||||
| Deliveries to customers | ||||||
| (‘000 units) | 2,552 | 2,623 | –2.7 | 5,039 | 5,066 | –0.5 |
| Vehicle sales (‘000 units) | 2,483 | 2,645 | –6.1 | 5,090 | 5,207 | –2.2 |
| Production (‘000 units) | 2,593 | 2,669 | –2.8 | 5,314 | 5,234 | + 1.5 |
| Employees | ||||||
| (‘000 at June 30/Dec. 31) | 597.8 | 592.6 | + 0.9 | |||
| Financial data | ||||||
| (IFRSs), EUR million | ||||||
| Sales revenue | 56,041 | 50,977 | + 9.9 | 108,776 | 98,808 | + 10.1 |
| Operating profit before | ||||||
| special items | 3,662 | 3,330 | + 10.0 | 6,990 | 6,186 | + 13.0 |
| Special items | –170 | – | x | –170 | – | x |
| Operating profit | 3,492 | 3,330 | + 4.9 | 6,820 | 6,186 | + 10.3 |
| as a percentage of sales revenue | 6.2 | 6.5 | 6.3 | 6.3 | ||
| Profit before tax | 3,696 | 4,420 | –16.4 | 7,664 | 7,777 | –1.5 |
| as a percentage of sales revenue | 6.6 | 8.7 | 7.0 | 7.9 | ||
| Profit after tax | 2,731 | 3,249 | –15.9 | 5,663 | 5,716 | –0.9 |
| Automotive Division | ||||||
| Cash flows | ||||||
| from operating activities | 6,861 | 6,137 | + 11.8 | 11,553 | 8,388 | + 37.7 |
| Cash flows from investing activities | ||||||
| attributable to operating activities*) | 3,572 | 3,167 | + 12.8 | 6,761 | 5,469 | + 23.6 |
| of which: capex | 2,581 | 1,953 | + 32.1 | 4,652 | 3,578 | + 30.0 |
| as a percentage of sales revenue | 5.3 | 4.3 | 4.9 | 4.1 | ||
| Net cash flow | 3,288 | 2,970 | + 10.7 | 4,791 | 2,919 | + 64.2 |
| Net liquidity | ||||||
| at June 30 | 21,489 | 13,979 | + 53.7 | |||
| Net liquidity | ||||||
| at June 30/Dec. 31 | 21,489 | 17,639 | + 21.8 |
*) Excluding acquisition and disposal of equity investments: Q2 EUR 3,518 million (EUR 3,147 million), H1: EUR 6,672 million (EUR 5,849 million).