
J.D. Power have released their full report on customer service satisfaction which shows some losses and some gains throughout the entire landscape.
Dealers are doing a better job at keeping customers informed during routine maintenance. Customers are also getting their cars back without their controls and settings being changed around. That’s good.

But service turnaround time is something that dealers need to update customers about. Also here’s how the brands stack up.
Here’s the full report.
PRESS RELEASE
Year-over-year gains in some aspects of customer service satisfaction were offset by losses in other areas, resulting in an overall customer satisfaction increase of 7 points to 761 (on a 1,000-point scale) from 2018, according to the J.D. Power 2019 Malaysia Customer Service Index (Mass Market) Study, SM released today.
The study finds that dealers are performing better in many aspects of the customer journey which drive satisfaction. When it comes to routine maintenance, more customers (80% vs. 75% in 2018) were notified and there is a 60-point difference in satisfaction between those who are notified, compared with those who were not. During the service process, more customers (86% vs. 74% in 2018) are kept informed of their vehicle status; with a 119-point difference in satisfaction between those who are kept informed and those who are not. Furthermore, more customers (71% vs. 64% in 2018) had their vehicle returned to them with controls and settings unchanged; satisfaction is 43-points higher in such instances.
Managing service turnaround time is a key area that needs to be addressed. While majority of customers (89%) had their vehicles serviced on the same day, fewer customers had their vehicle serviced within two hours (52% vs. 62% in 2018). Satisfaction among this group of customers is higher (776 points) than among those whose service took longer (748 points). The proportion of customers who are not told when their vehicle would be ready has also increased (12% vs. 6% in 2018).
Following are additional key findings of the 2019 study:
Facilities are improving: Facilities are increasingly offering amenities like complimentary snacks/beverages (+2 percentage points from 2018) and workspaces to plug in computers (+8 percentage points). However, slightly fewer customers are staying at the dealership (65% vs. 68% in 2018); getting customers to stay back at the dealership matters as they are 11 points more satisfied than those who decided to leave and return later.
Rise of the digital channels: While calls remain the most frequently used mode of communication with 73% of customers using it to fix appointments, there is an emergence of digital modes as the preferred mode for scheduling. Among these are manufacturer apps (9%); chat or messaging services such as WhatsApp, Messenger (8%); website (4%); and SMS/text messages (4%). Additionally, the functionality of digital channels is also improving. Among customers who make online appointments, 28% indicated they are able to enter all required information and complete
service scheduling online without follow-ups, up from 18% in 2018.
Study Rankings
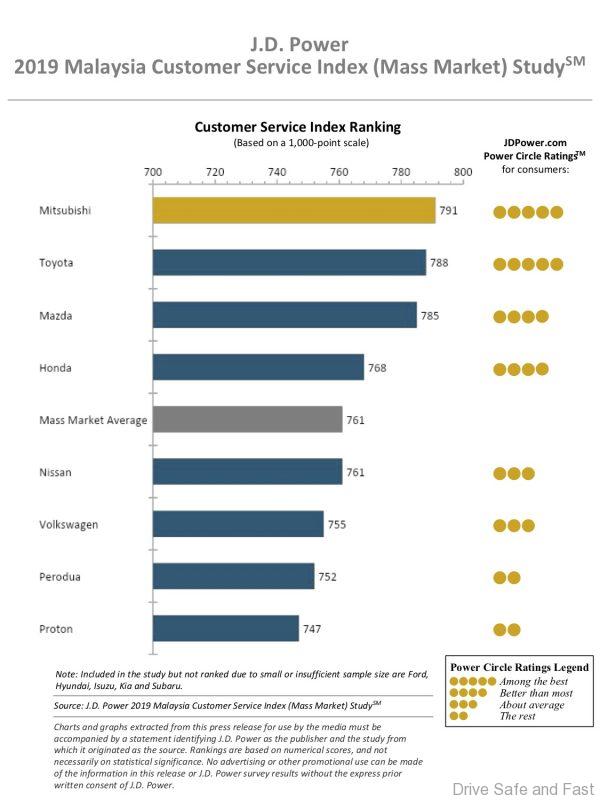
Mitsubishi ranks highest in overall satisfaction with a score of 791. Toyota ranks second with a score of 788 and Mazda ranks third with a score of 785.
The J.D. Power 2019 Malaysia Customer Service Index (Mass Market) Study SM is based on responses from 2,644 vehicle owners, who received delivery of their new vehicle between February 2016 and June 2018 and took their vehicle for service to an authorized dealer or service centre between February 2018 and June 2019. The study was fielded from February through June 2019.
Now in its 17th year, the study covers owners who bought their vehicle in the past 12-36 months and serviced it at least once in the past 12 months at an authorised service centre. The study measures overall service satisfaction among owners who took their vehicle to an authorised service centre by examining dealership performance in five factors (in order of importance): service quality (25%); vehicle pick-up (21%); service initiation (20%); service facility (17%); and service advisor (16%). Overall satisfaction for the industry averages 761 points.
The study also includes the Net Promoter Score ® (NPS) 1 , which measures customers’ likelihood to recommend their vehicle brand on a 0-10 scale.