
Let’s preface this with a disclaimer: this is more entertainment than actual statistical analysis.
Yes, it’s based on facts, but the analysis here was done by one fat unqualified guy on a coffee streak. The figures were all keyed into an excel sheet so if there are errors, please let us know.
At dsf.my we’ve noticed that one of the biggest hitting weekly article for a lot of media outlets has been the weekly fuel price announcement. What really interests us is how this whole thing has played out over the last 6 months.
Here’s a chart we made using the weekly fuel prices that are announced by the Ministry of Domestic Trade, Cooperative and Consumerism (KPDNKK). The Y-Axis represents RM/litre, the X-Axis represents each Week since the policy was put into action.
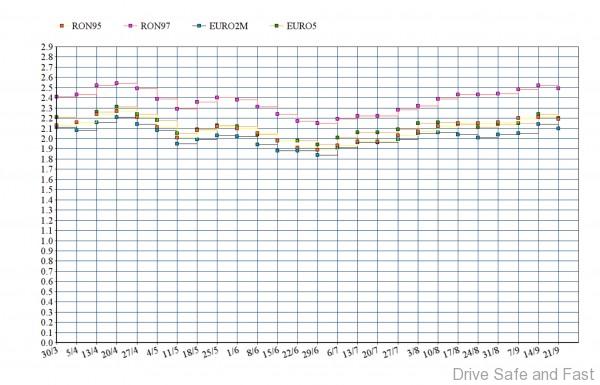
1) It More or Less Fairly Reflects Actual Oil Prices
Here’s what the average crude oil barrel costs in around the same time frame. Notice anything?

Well, not much given how poorly we’ve put the data together here (we do car news, not economics).
But one thing that does stand out is that the weekly prices from KPDNKK and the Petroleum Dealers Association of Malaysia (PDAM) seem to more or less correspond to the global prices. KPDNKK have stated that their calculations are based on the Means of Platts Singapore and the value or the Ringgit, so that explains why it’s not exactly the same. Overall, we can’t be too mad about any variance.
2) Here’s How PDAM and KPDNKK Respond to Rising and Falling Prices
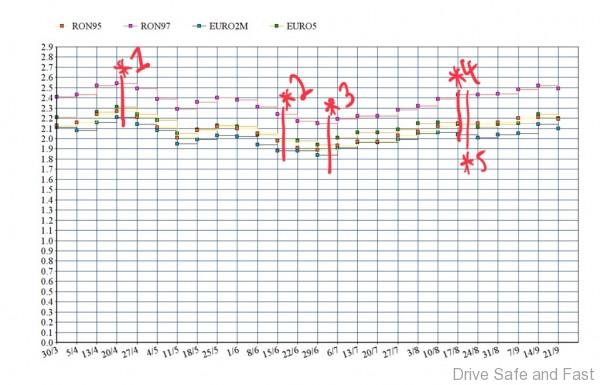
*1 On the last week of April, after 3 weeks of rising prices, there’s talk from Petronas that dealers may offer discounts with permission from Petronas Dagangan KPDNKK. Basically, if some dealers had the volume to compensate for lost income, they can offer their own discounts. This DOES NOT happen. Fuel prices drop a week later.
*2 On the third week of June, as the price of fuel plummets, PDAM says the price fluctuation is unhealthy, a New Formula to calculate prices is talked about. This does not happen.
*3 On the first week of July, as the price of fuel reaches its lowest point, there’s talk of switching to a DAILY PRICE announcement instead of weekly. Daily announcements do not happen.
*4 After fuel prices rise for about 2 MONTHS, KPDNKK says weekly determination is the best.
*5 Shortly after, they clarify that the price is calculated based on average world prices for the week while taking into account the value of the currency.
These were taken from official responses from KPDNKK and PDAM based on various news reports.
It’s pretty clear that this has been a pretty costly exercise for the petroleum dealers, especially when the fuel prices drop drastically. We can’t imagine the kind of work that goes into keeping a petroleum company running with decent margins when every week your buying and selling prices fluctuate.
3) After 6 months, the consumers won! Kind of.
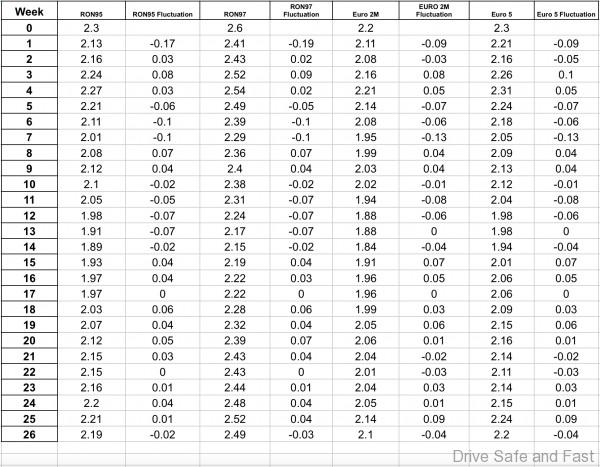
So after 26 weeks, has anything really changed? Well yes. The price of RON 95 stood at RM2.30 per litre before this began and the closest it has come to that figure since was in week 4 when it hit RM2.27 per litre.
On average over the last six months, Malaysians have been paying:
- RM2.09 per litre of RON95
- RM2.37 per litre of RON97
- RM2.02 per litre of EURO2M Diesel
- RM2.12 per litre of EURO5 Diesel
4) Emotions aren’t real, data is real (but our calculations could be wrong)
These announcements have a big emotional impact on Malaysians, especially in this economy. It wouldn’t be a stretch to say that it’s not the price but the CHANGE in price that incurs emotion. If the price drops by 2 cents to RM1.89/litre (Week 14, RON95), it’s not as big a happy moment as it was during the initial drop of 17 cents.
Vice versa, the increase in price to RM2.24/litre (Week 25, Euro 5 Diesel) was probably more anger-inducing because it was a huge 9 cent increase.
So on the whole, over the last 6 months, should you be feeling happy or angry on average?
Well, based on our dodgy excel formula, on average, you shouldn’t be feeling much at all. The ups and downs almost cancel each other out. On average, you should be feeling less than half a cent happier based on the last 26 weeks of price fluctuations.
To everybody who lined up at the pumps to save a buck, we salute you.
The End
So there you have it. If you liked this post and want to see more like it, let us know on our Facebook page or here. If there are any errors, please do let us know as well. Numbers are not our strong suit.